Browsing the heatmap report
The heatmap report presents all the active projects in a selected period and their associated status reports for three months before, including the predicted status for the ongoing month.
In order to browse the heatmap report, you need to navigate to the “Heatmap” page (the fourth option in the menu).
The entire projects portfolio will be displayed in a table view like the one below.
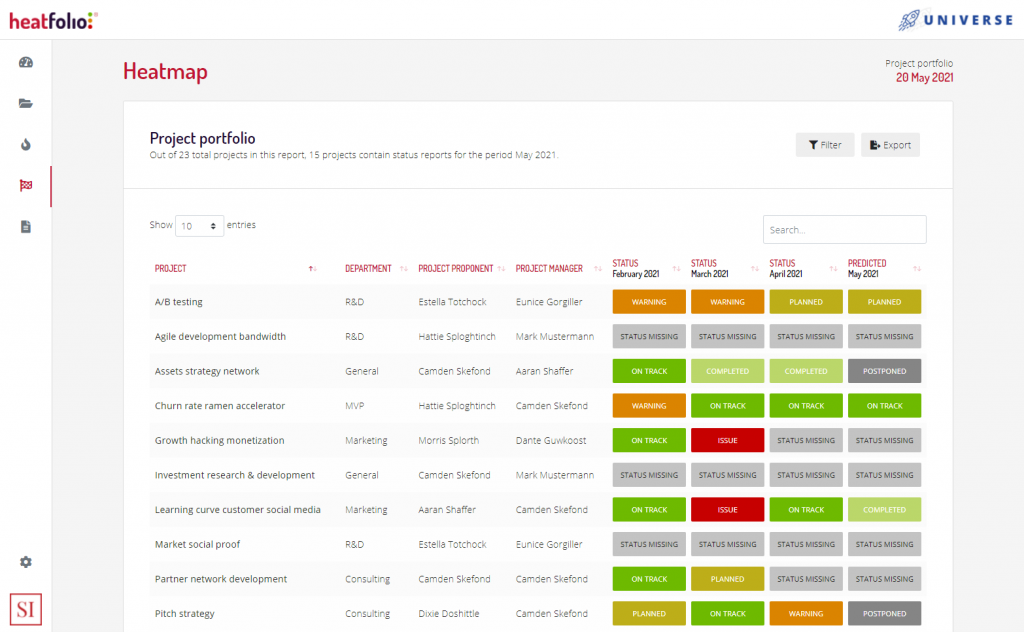
The heatmap report page, listing active projects and their previous three periods (current status).
This will allow you to easily track the progress of a project over the past three months and jump to any of the status reports by clicking the associated item in the heatmap. Clicking a project item will display you the detailed project view.